
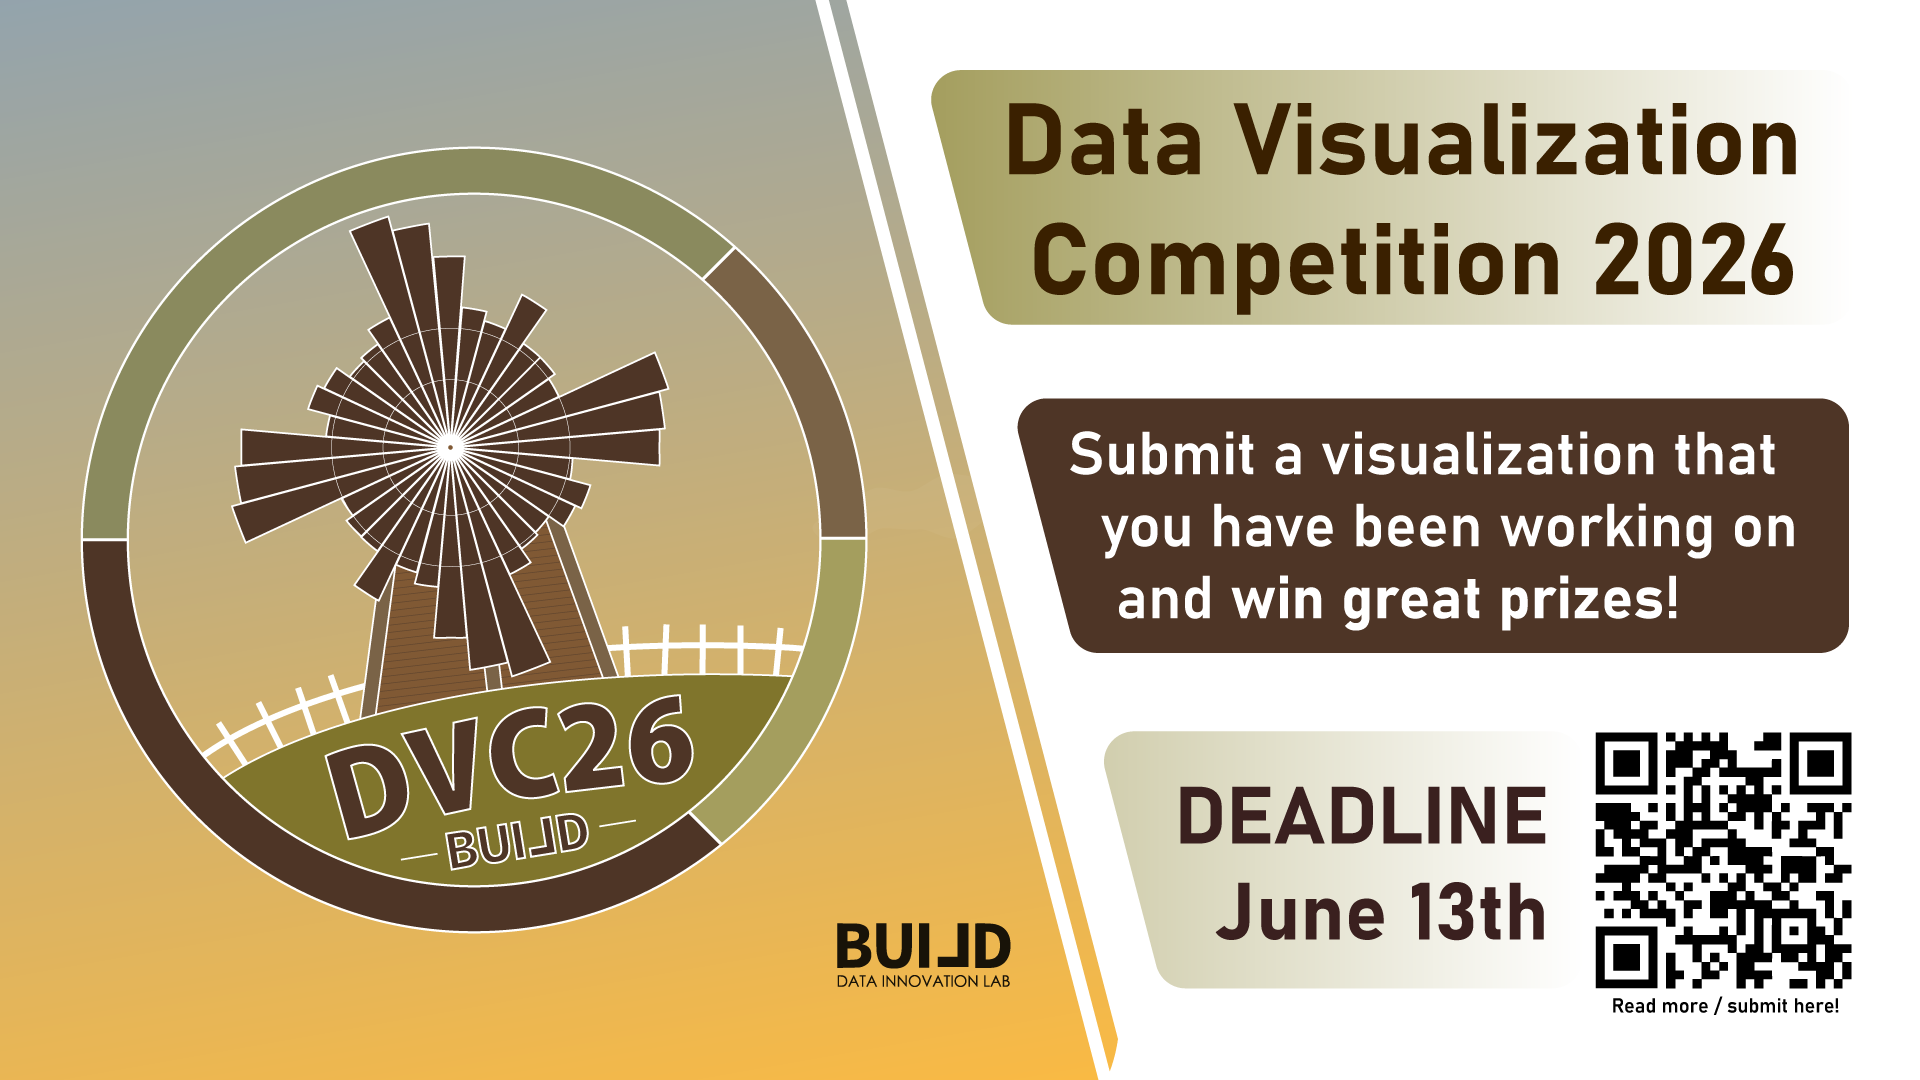
Data Visualization Competition 2026 Results 🏃♂️ Runner-up 🏃♂️Human Development Index Taha Zaman Khan Khattak,Matthew Nañaga Rangstrup,Malik Jensen The dashboard visualises the UNDP developement data. The target audience is anyone intrested in finding their country’s performance over time across different metrics. Users can interact with the dashboard and explore different metrics, such
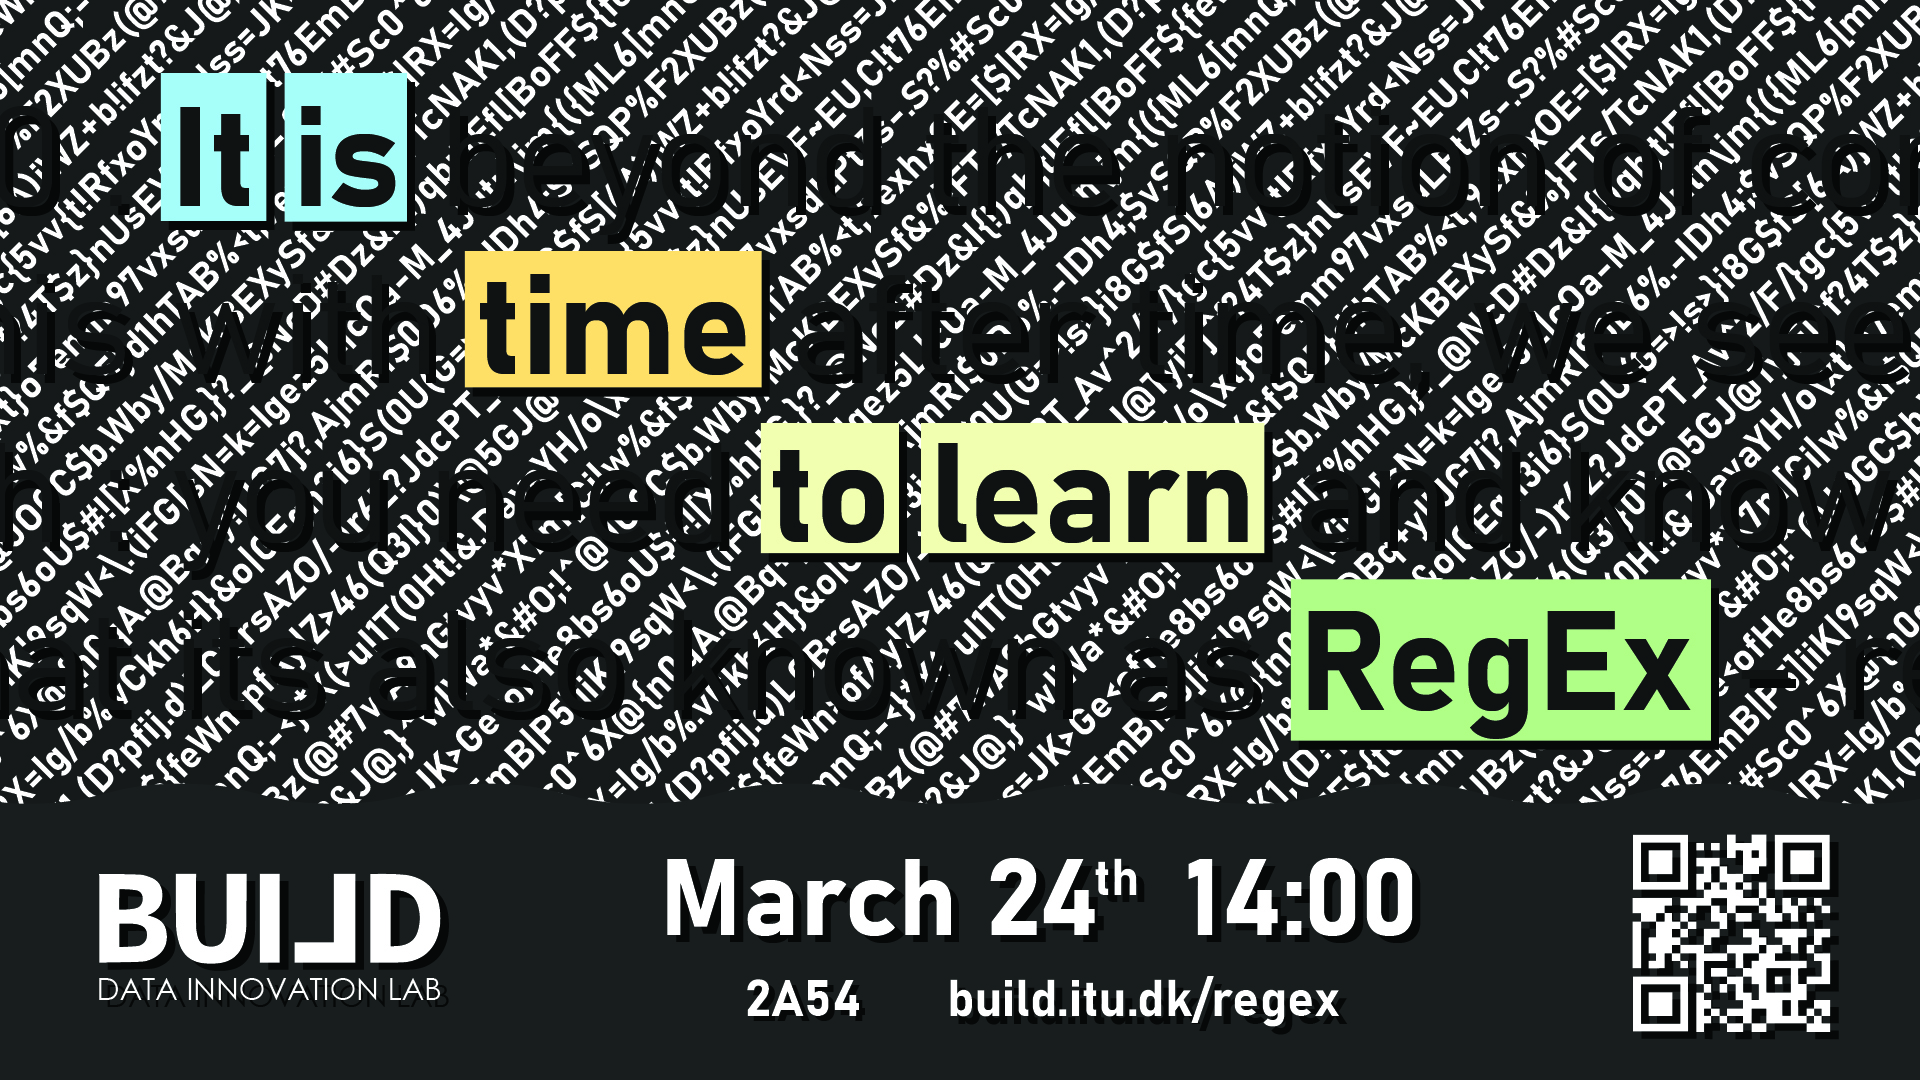
RegEx – regular expression – is a defined by a sequence of characters, which is then used as a match pattern to single out various strings within text. It can be used in conjunction in almost all programming languages to develop efficient algorithms. Whether you are working Excel, SQL, Python,

Join us with your industry project for case collaboration with our bachelor’s and master´s students at IT University of Copenhagen at the Case Fair 2026. Become an industry partner by bringing your case and in return gain insightful ideas and prototypes for your business or institution. The goal of your
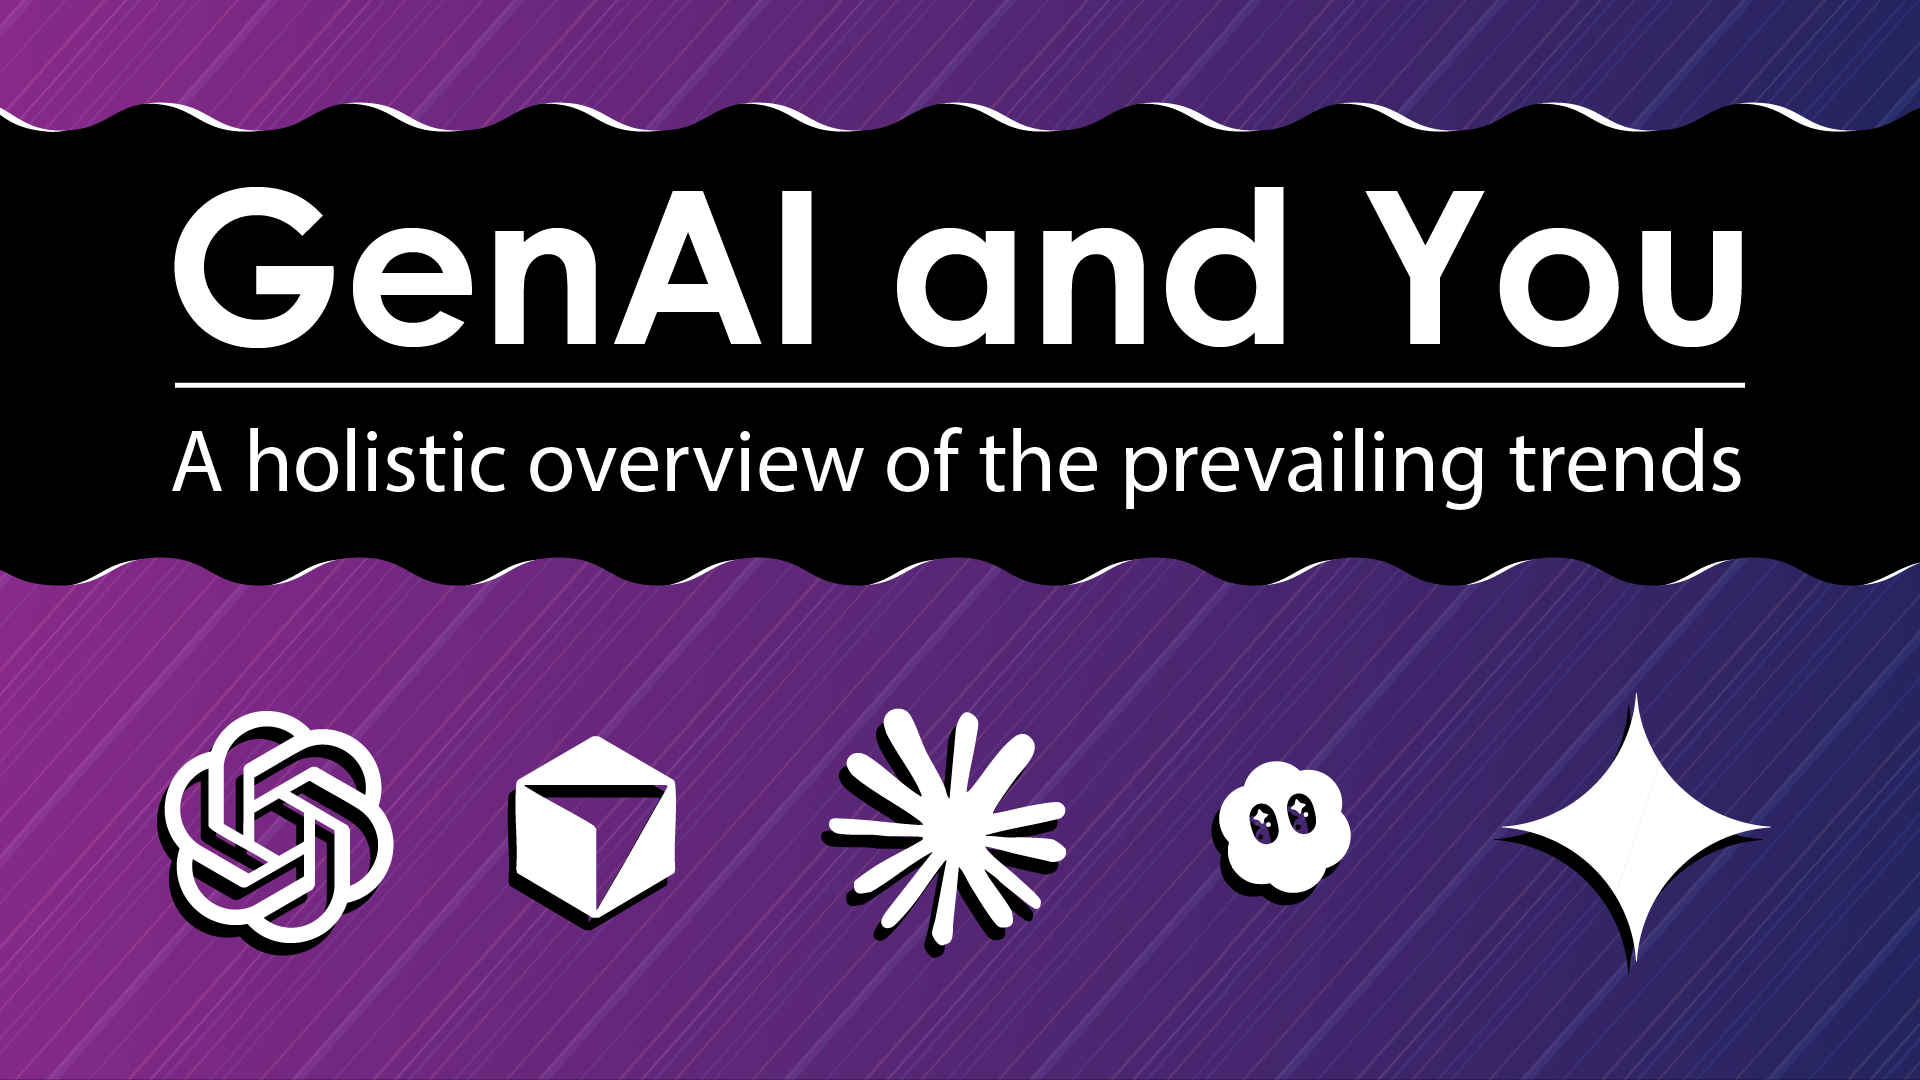
A workshop bringing you up to speed on the latest developments of GenAI Do you have a feeling that it is difficult to keep up with the latest developments of GenAI? Perhaps seeing all those articles and social media posts titled with “it has changed everything…” has gotten a bit
Data Visualization Competition 2025 Results 📢 Shout-out* 📢 *The submission does not fall in line to be judged by our usual criteria, however, it deserves recognition for being unique! Time Prism Tao Højgaard Time Prism is a 10-minute audio-visualization of Denmark’s social transformation (1820–1920), presented as a multichannel sound installation.