*The submission does not fall in line to be judged by our usual criteria, however, it deserves recognition for being unique!
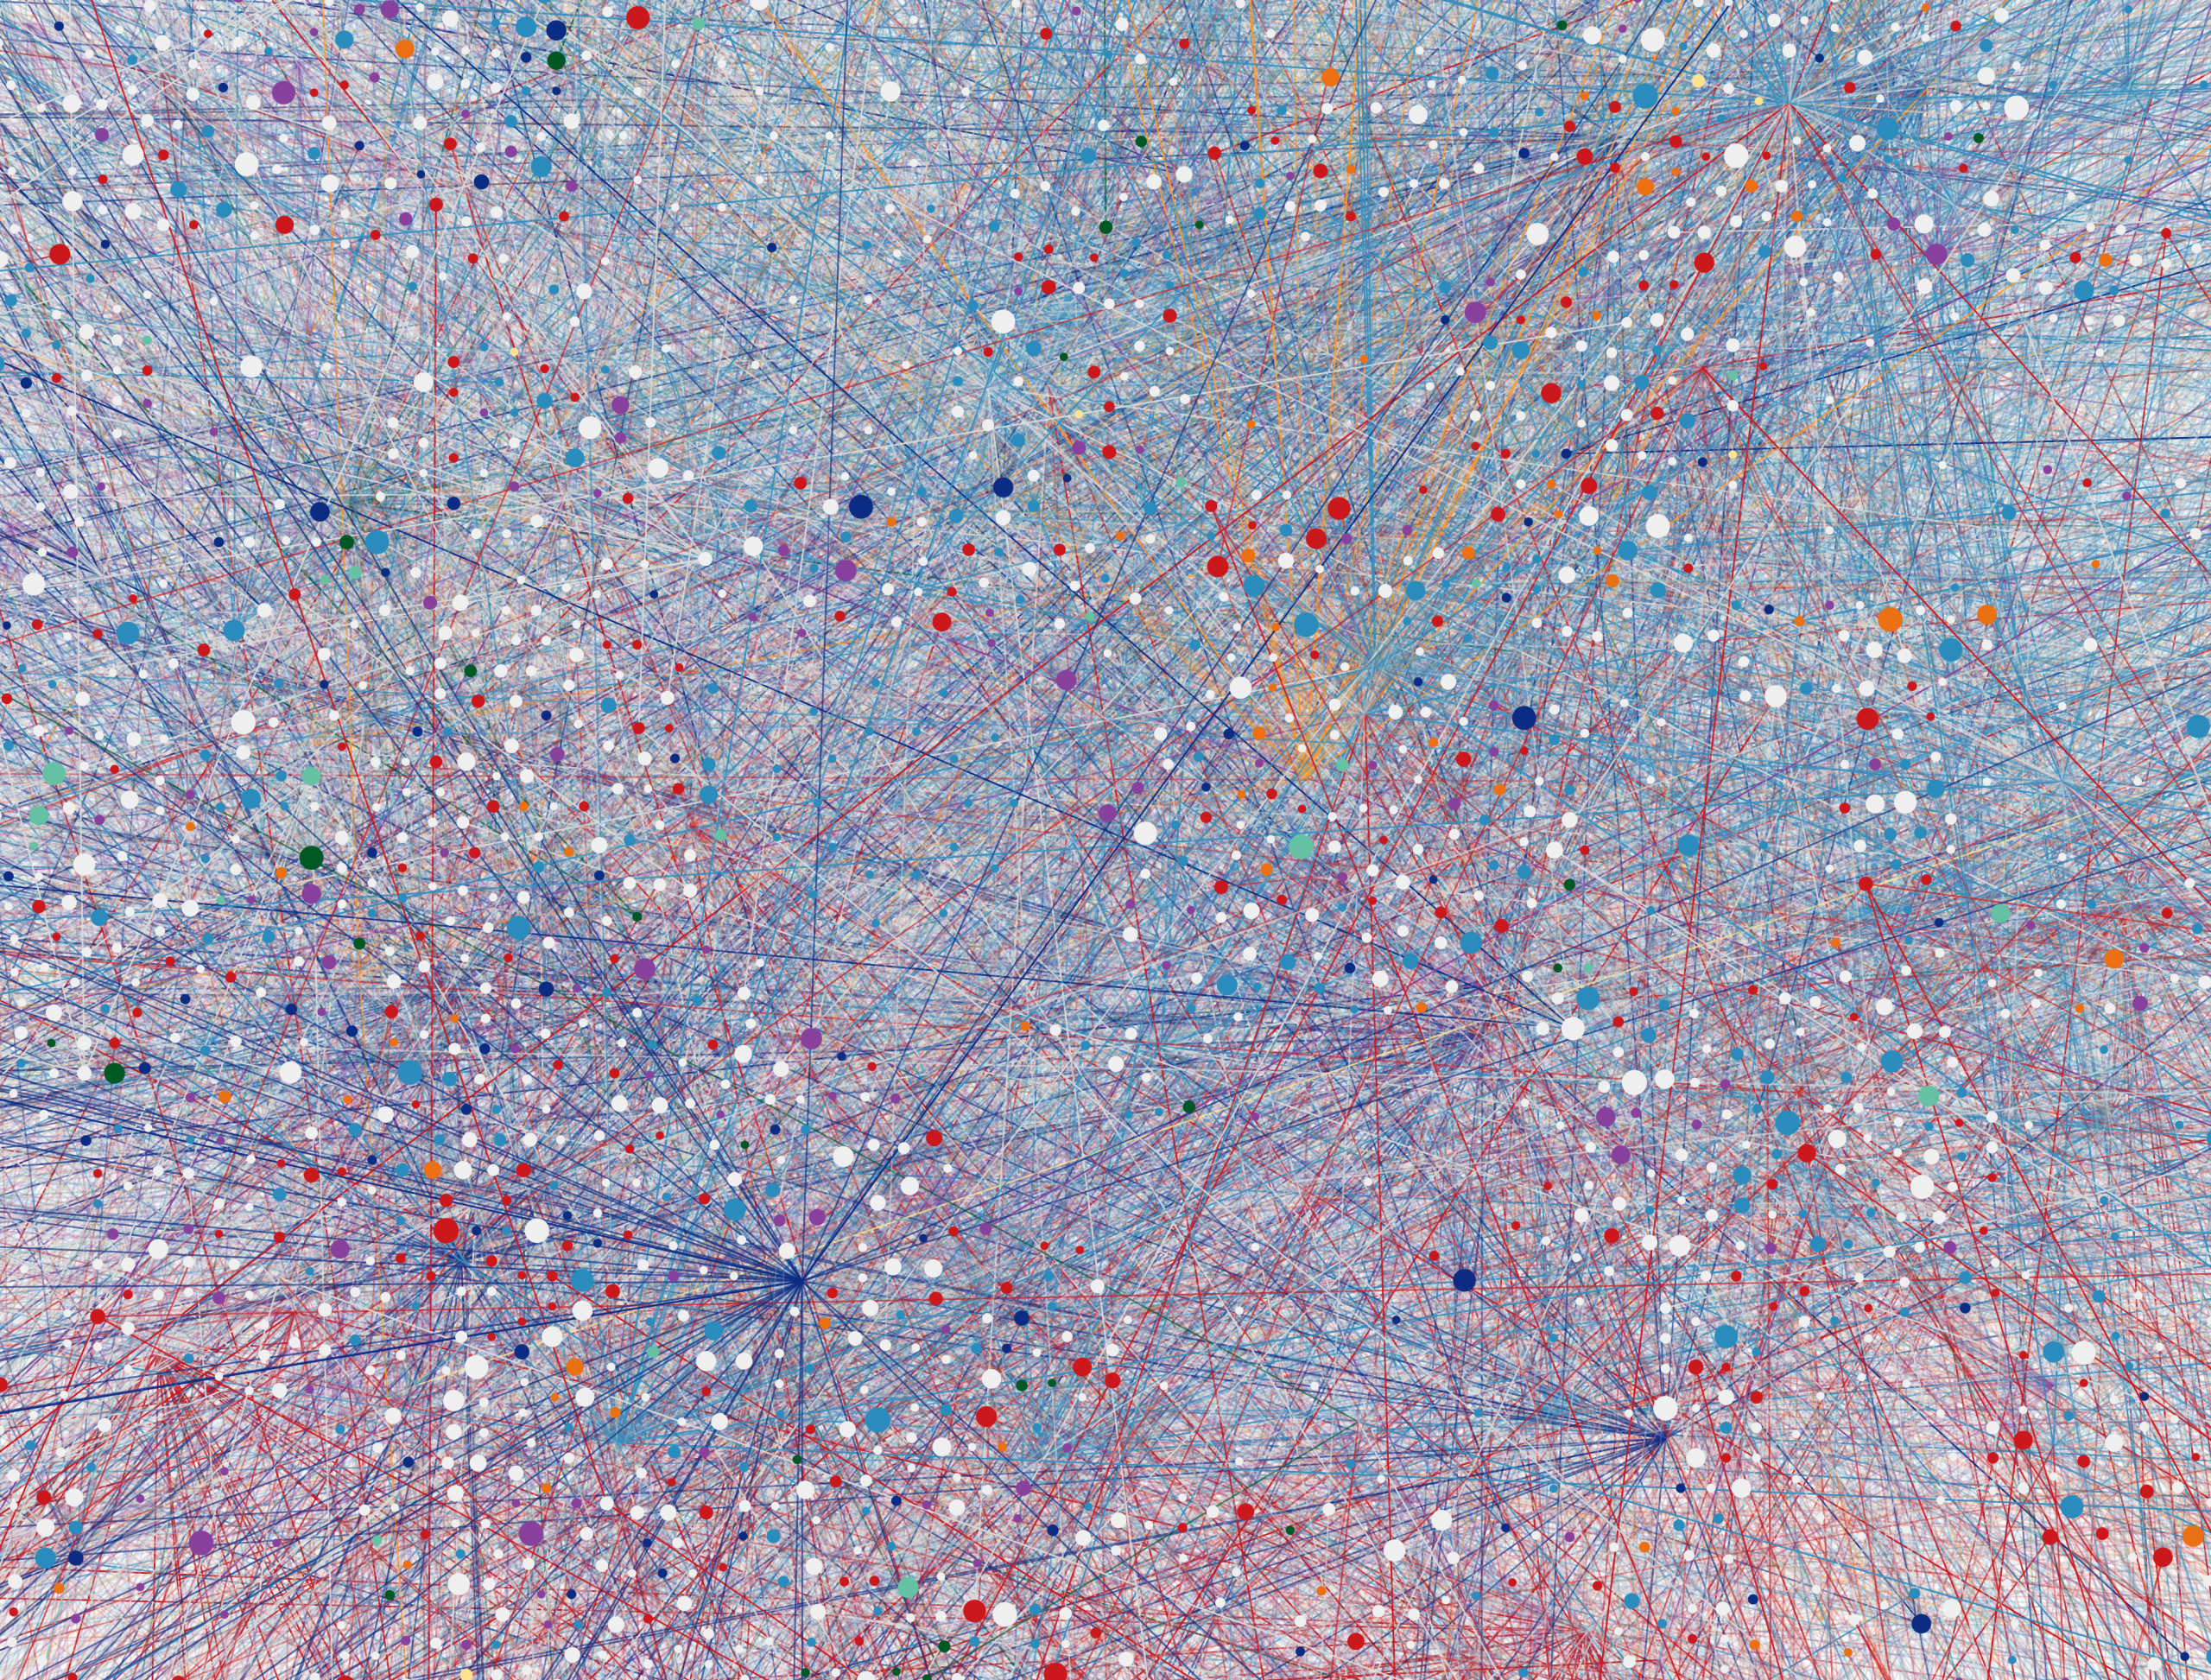
Time Prism
Tao Højgaard
Time Prism is a 10-minute audio-visualization of Denmark’s social transformation (1820–1920), presented as a multichannel sound installation. Five loudspeakers represent societal actors (King, Church, Farmer, Citizen, Worker), each with a distinct timbre and harmonic identity. Discretely sampled historical data is interpreted as dynamic volume curves, rendered in real-time sound and linearly interpolated to produce perceptual continuity. The visual layer—animated circles varying in size, opacity, and color—is synchronized but secondary, supporting orientation.
As an experiment of sound art as epistemic method, the work invites embodied engagement with how historical change unfolds across time, depending on its granularity and affective resonance.
🏃♂️ Runner-up 🏃♂️
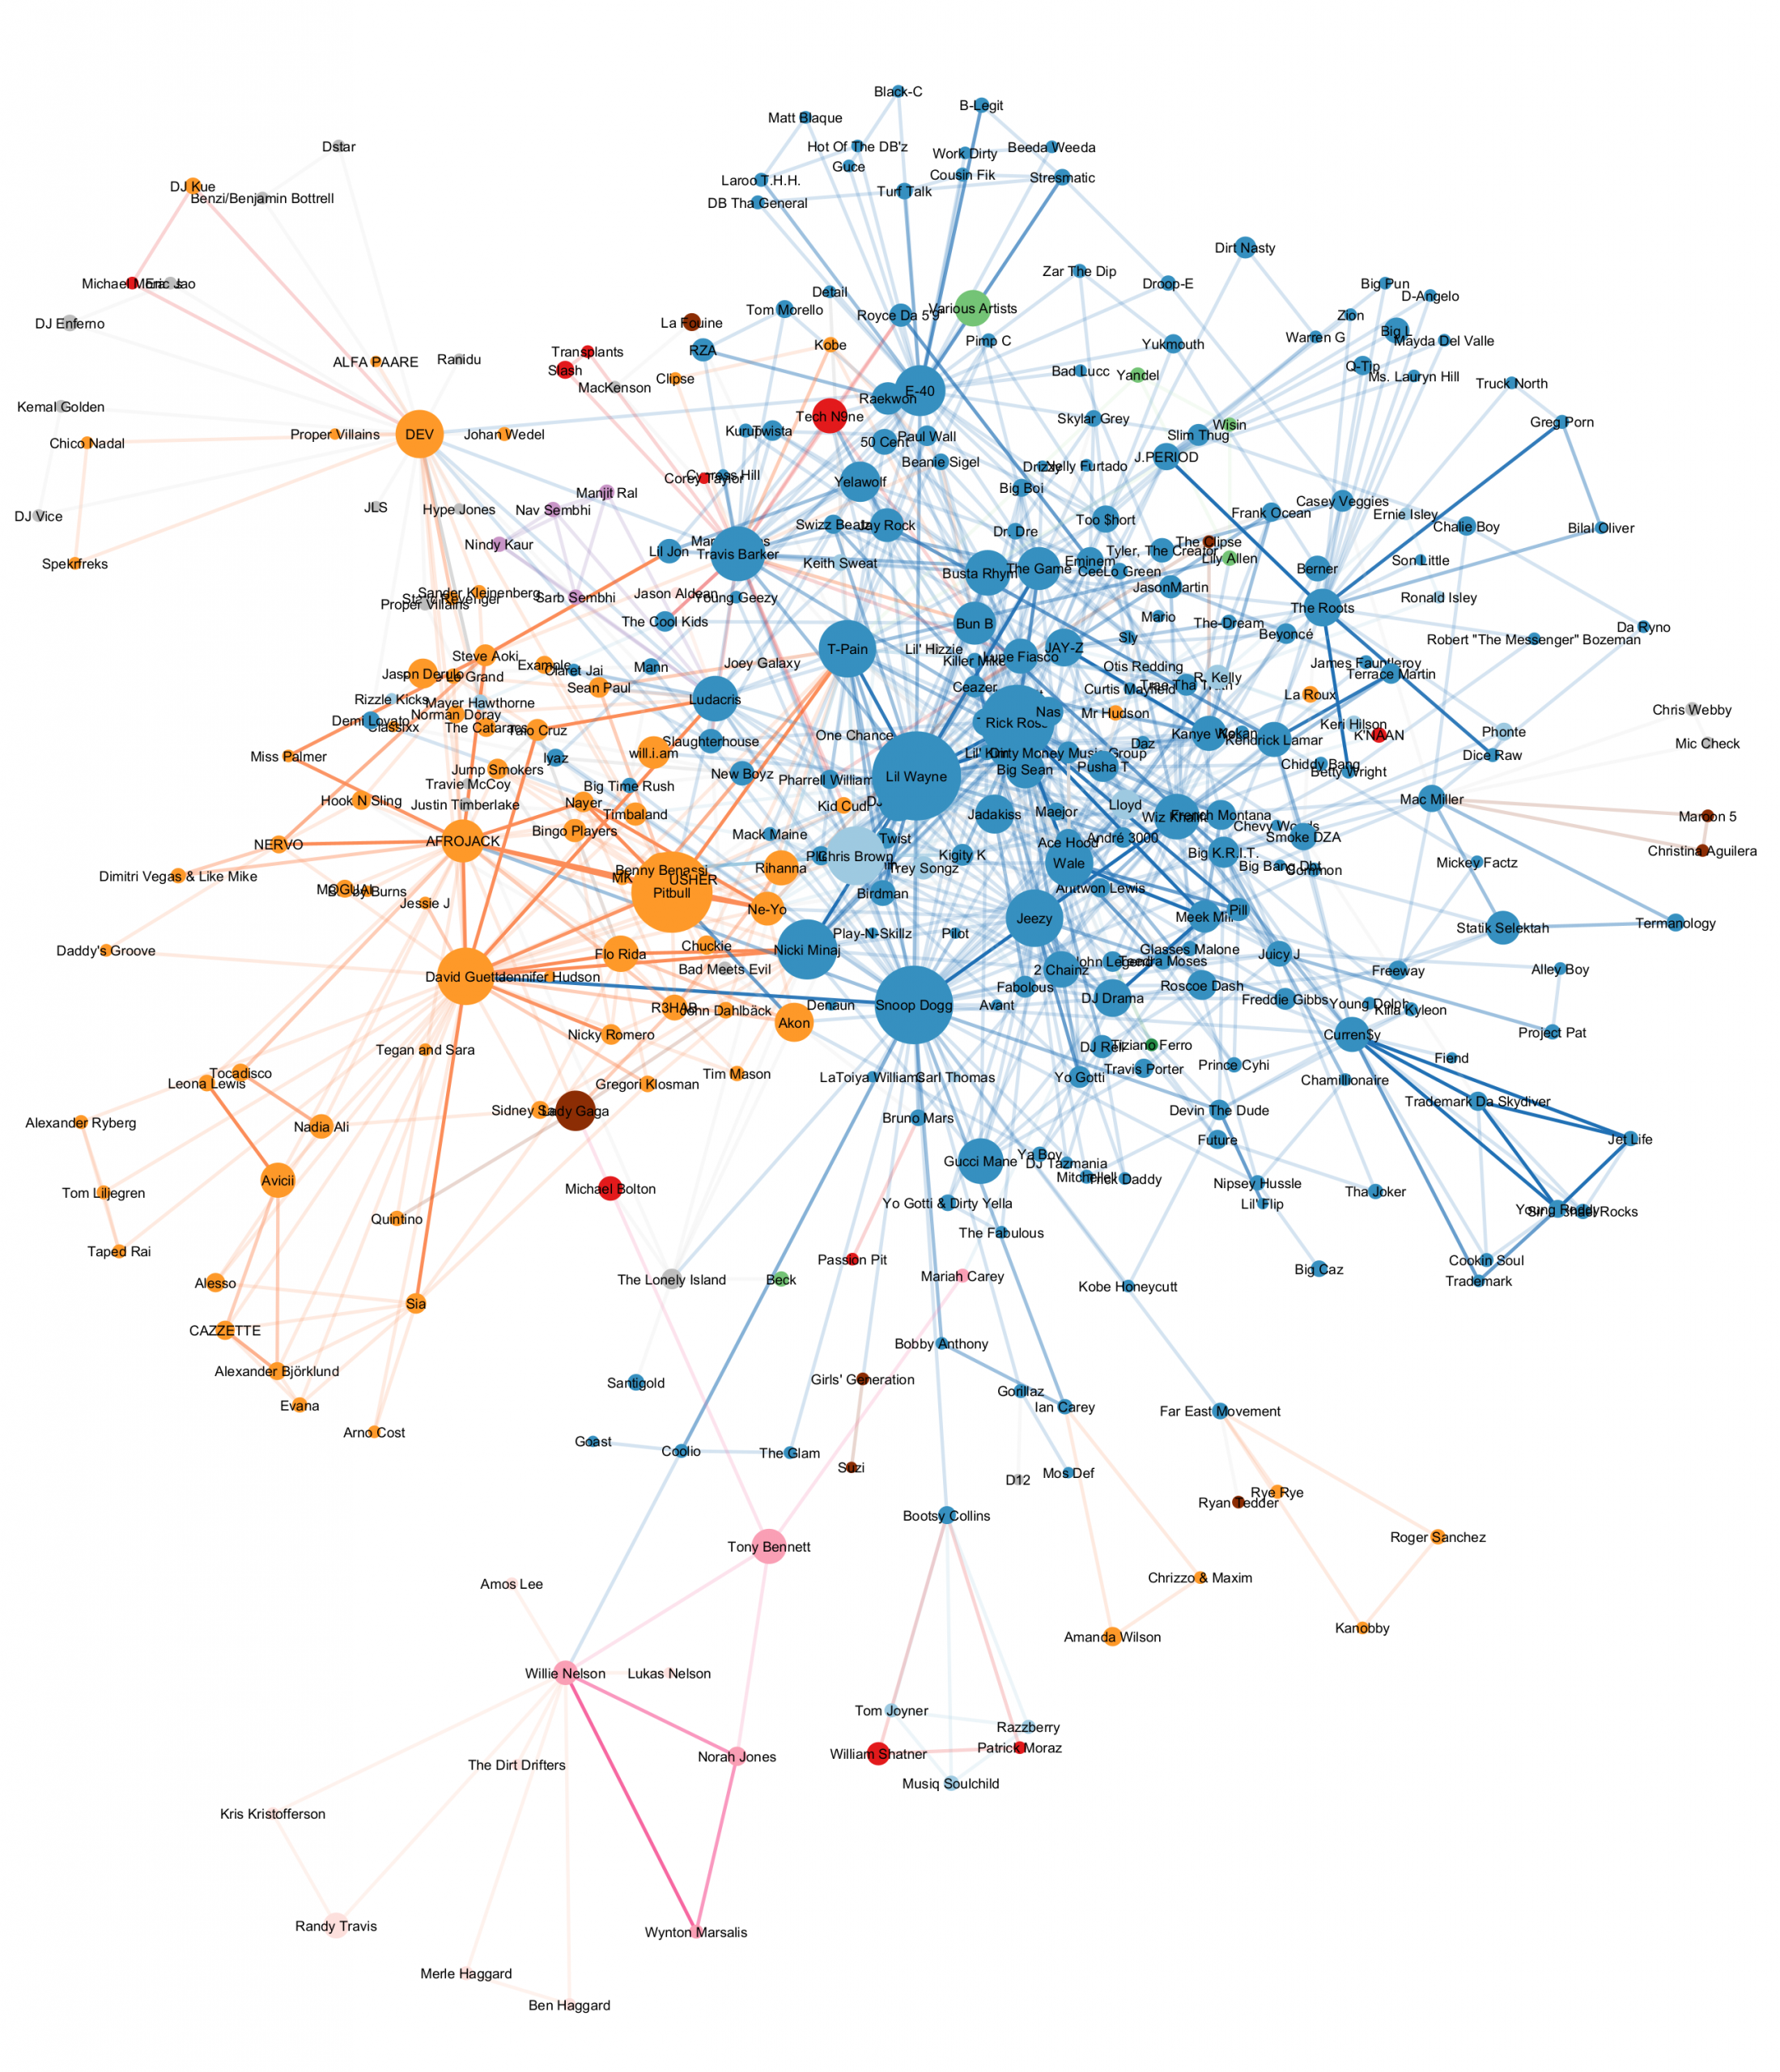
Spotify Artist Network Analysis
Erik Malmqvist Jakobsen
Graph visualization of artist collaborations based on data from the Spotify Web API. Artists are represented as nodes, with edges indicating collaborations. Node size reflects an artist’s degree (number of collaborations), while colors represent different music genres.
The project was about using network concepts like centrality and entropy to describe the diversity of artists collaborations.
🥉 3rd place 🥉
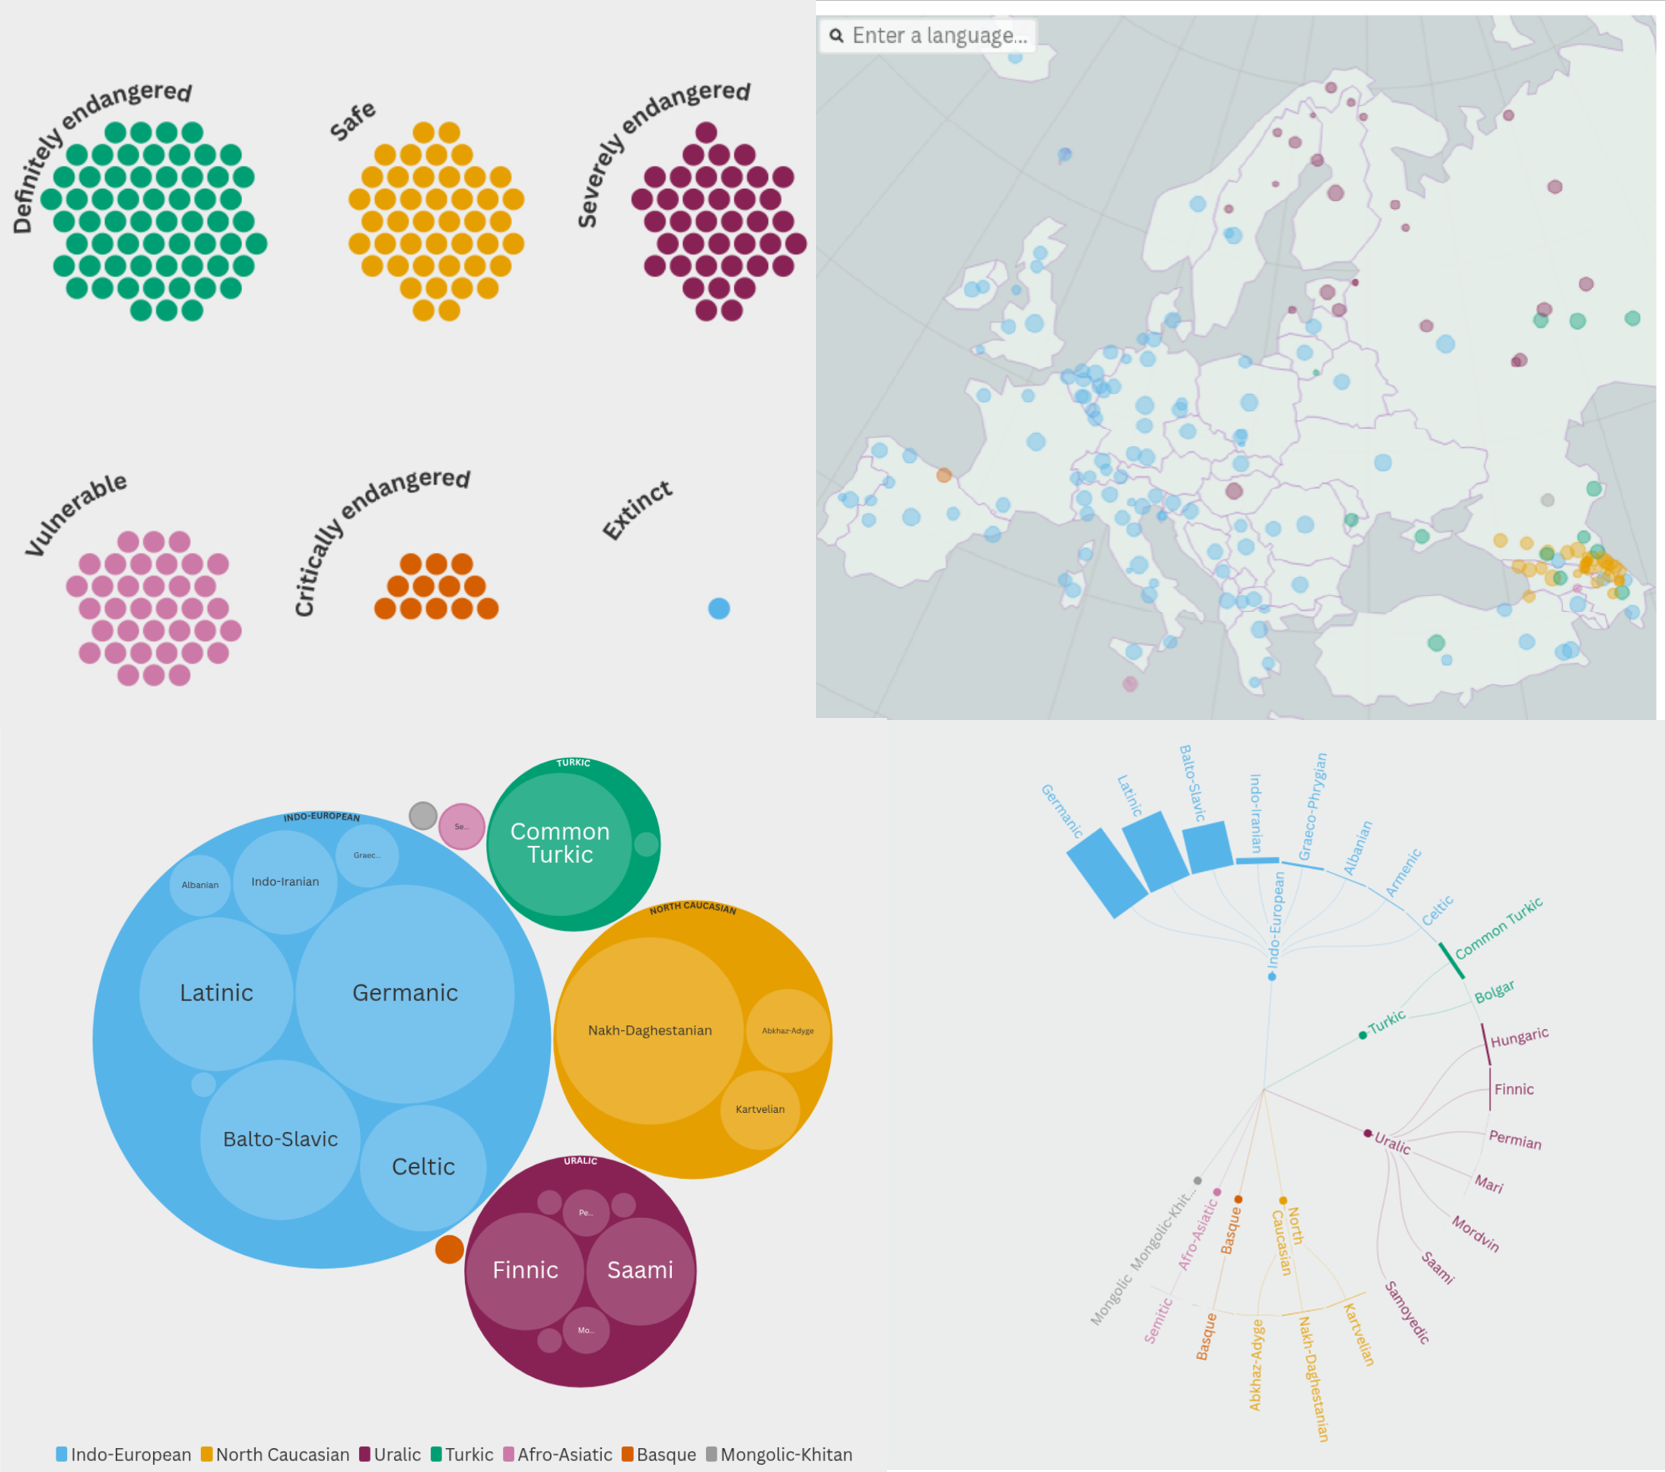
European Languages
Dimitar Dechev Kochev, Mihael Svilenov Stoyanov
The visualization is aimed to take the viewer on a journey through the European language diversity and further showcase how distributed are the languages within the region.
With our project, we want to raise awareness of the diversity of European languages and their historical relations. Additionally, we want to educate viewers about languages that are at risk of extinction and encourage efforts for preservation.
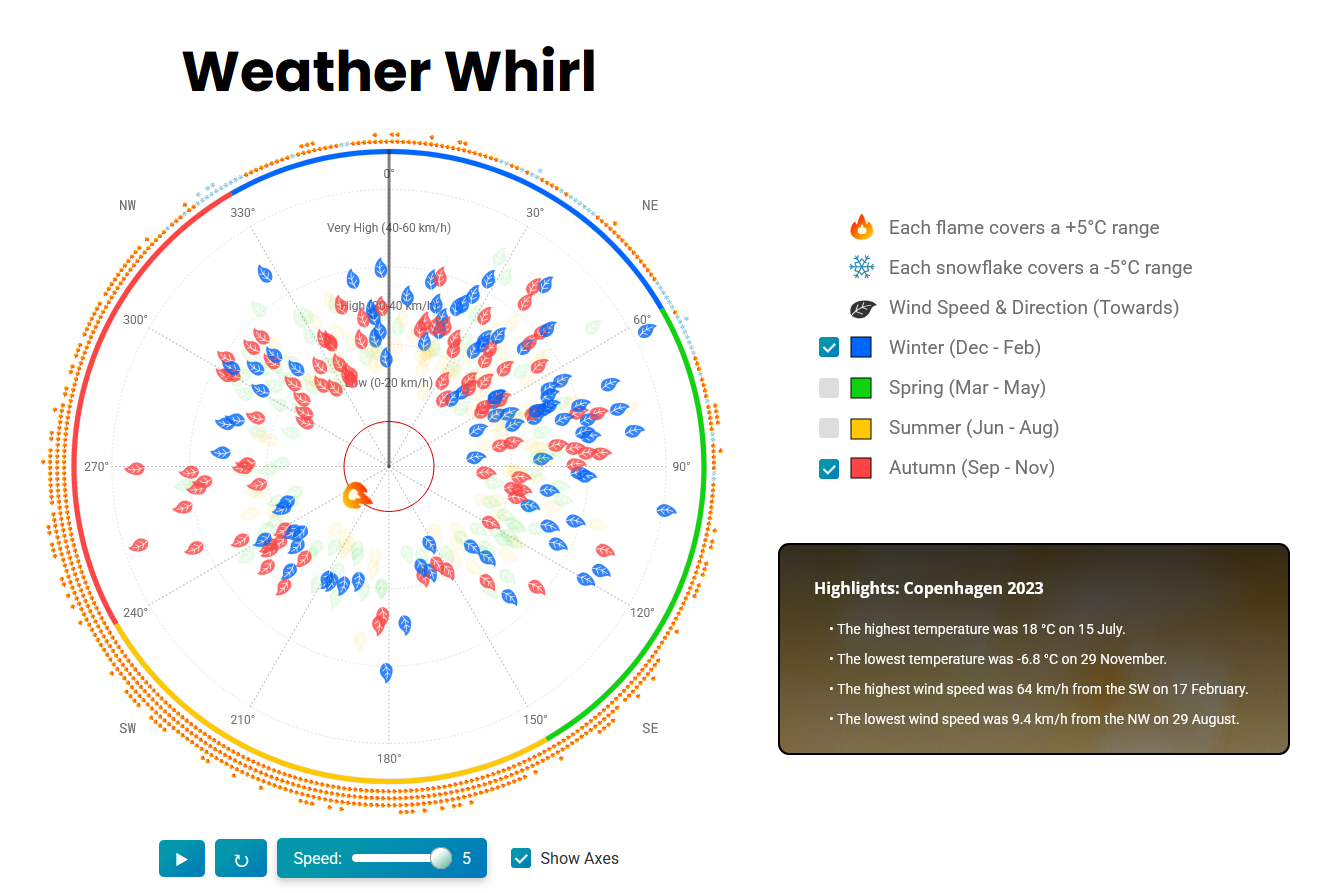
🥈 2nd place 🥈 Weather Whirl
Phi Va Lo
This project is a data visualization prototype that visualizes the weather forecast for Copenhagen in 2023. The objective is to explore and present the interplay between temperature and wind patterns across the seasons using rich and engaging experience. Unlike traditional line charts or bar charts, this visualization aims to offer a more immersive and aesthetically pleasing representation of weather data.
The visualization uses shapes, colors and positions to represent the temperature, wind speed, and wind direction, and how they change over time. The visualization is also designed to be clear and easy to understand through an animated visualization, and a final dashboard that summarizes highlights and trends.
🥇 1st place 🥇
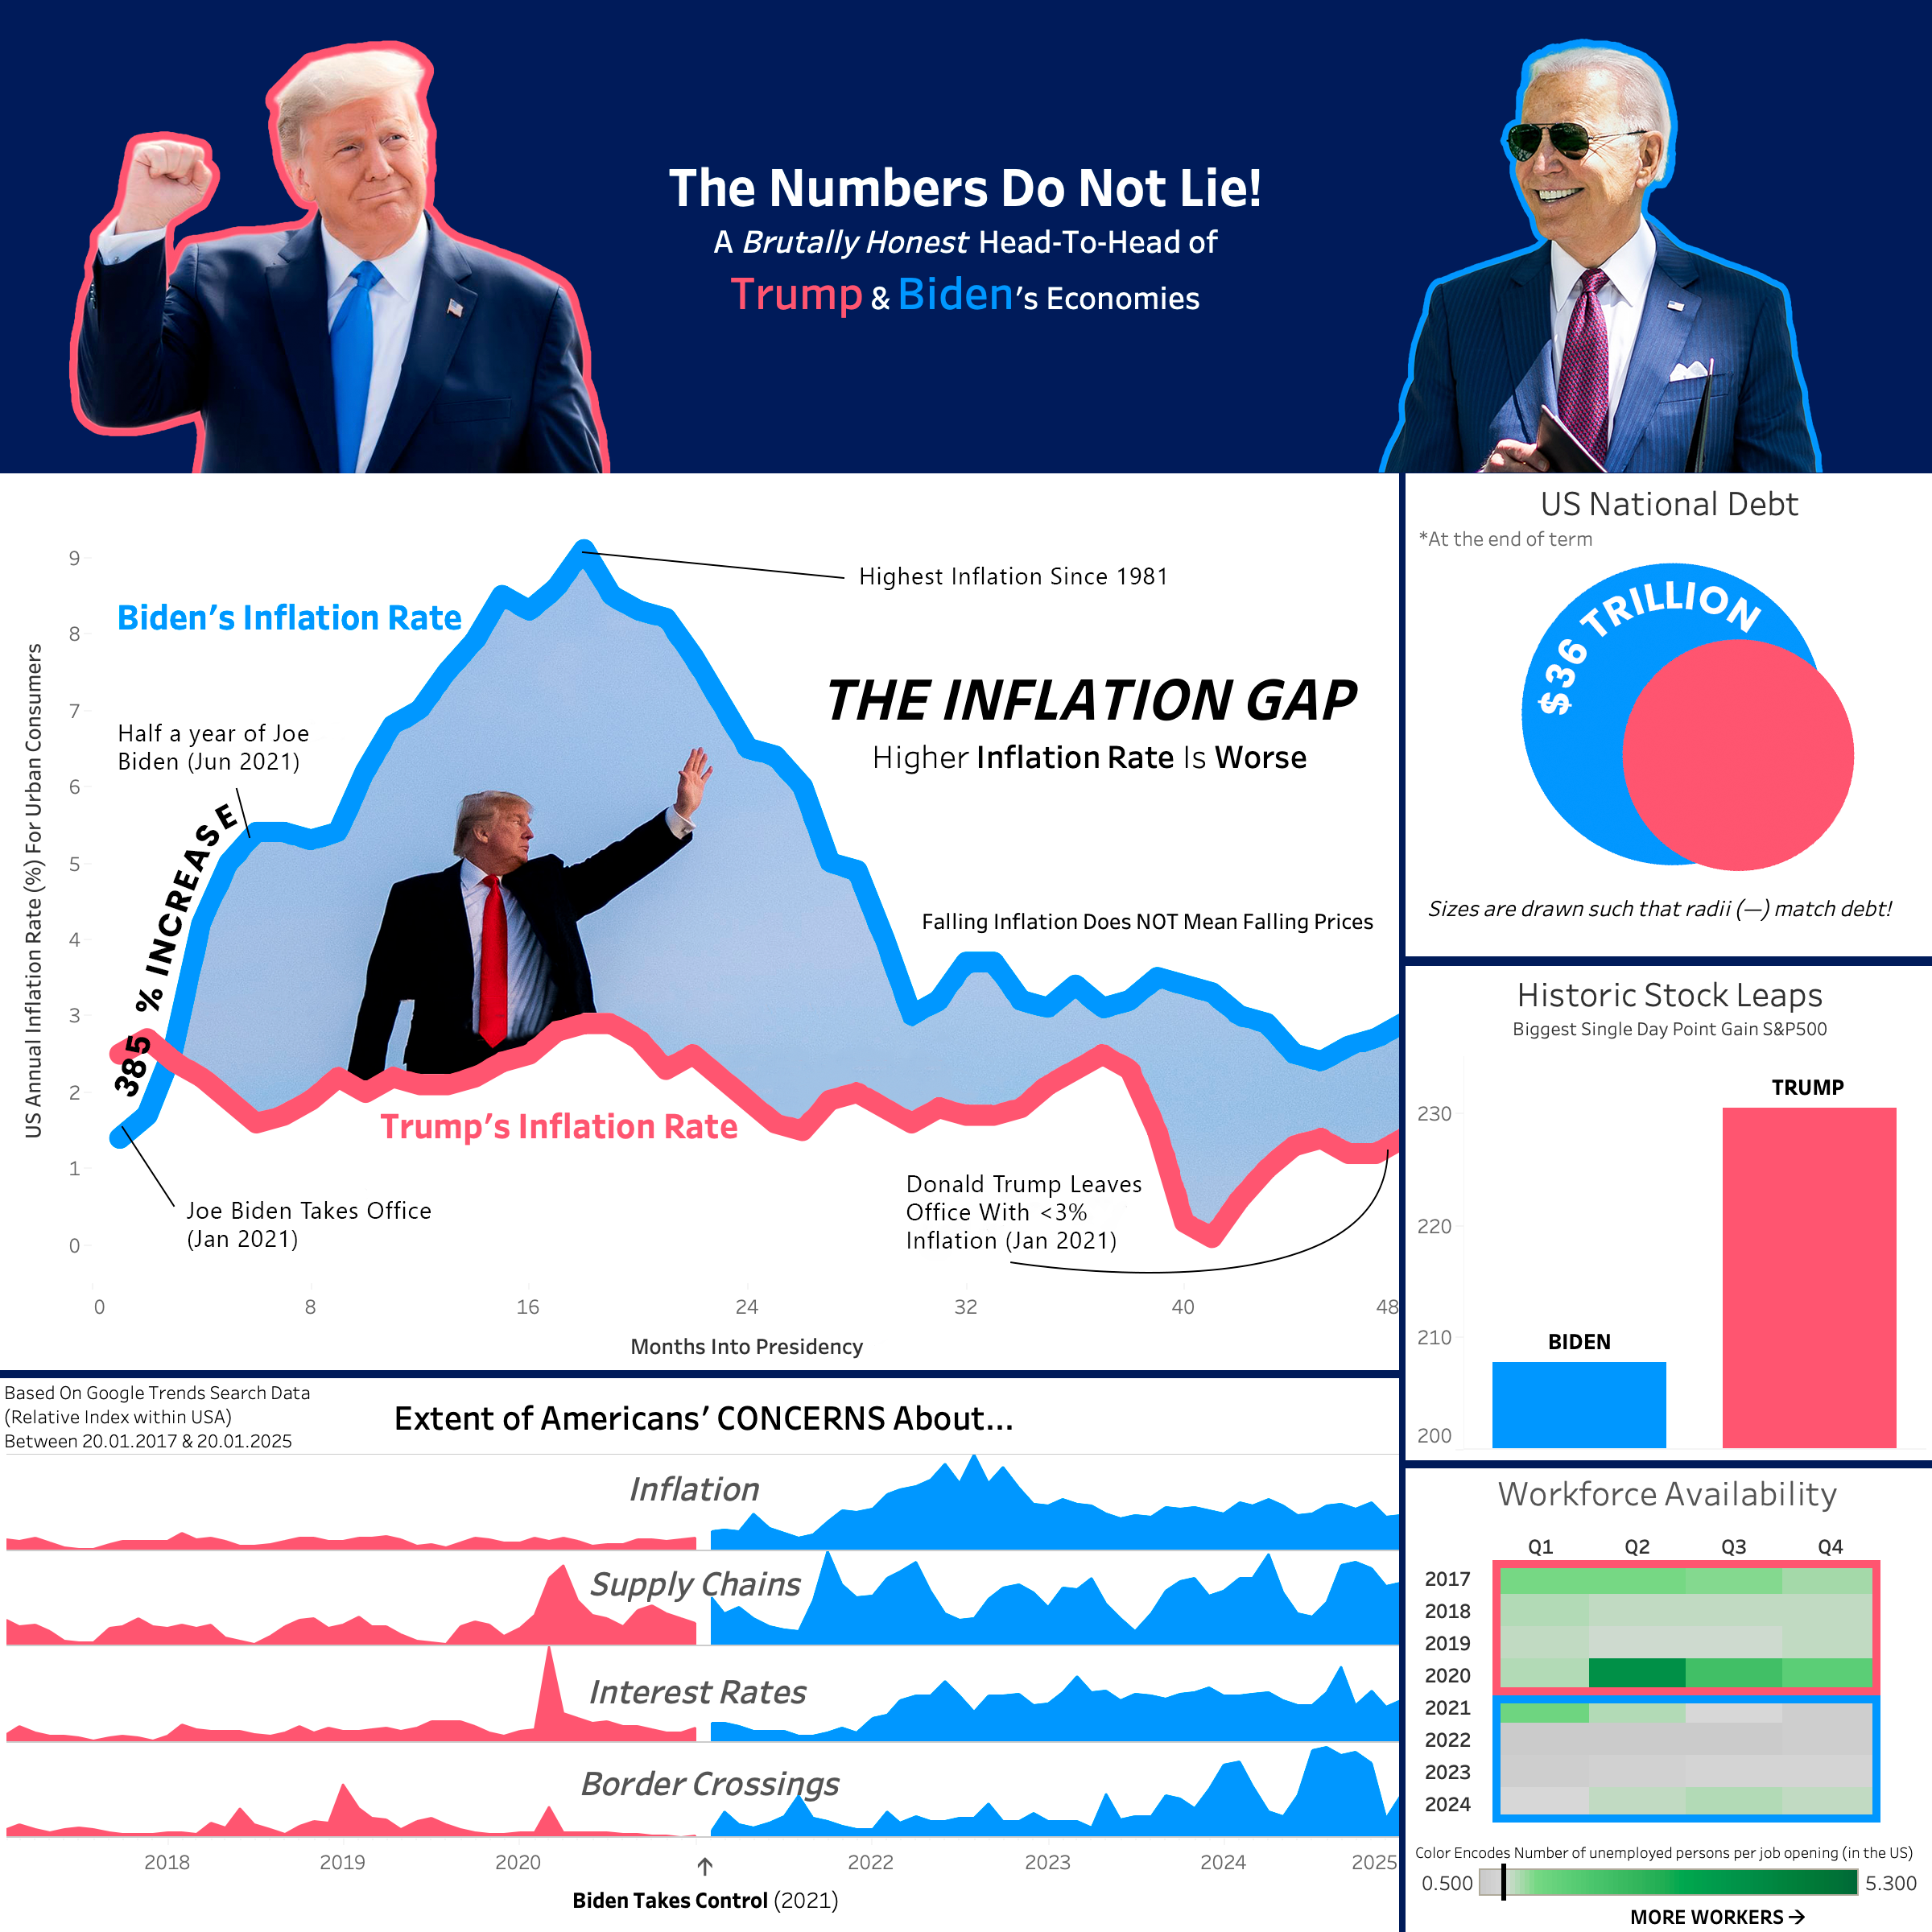
The Numbers Do Not Lie!
Wiktor Pedrycz, Willian Olfert Michelsen
With our infographic, we sat out to create a visualization that is intentionally misleading, while using elements from narrative data visualization to strengthen and communicate a narrative, complementary to the deceitfulness of the visualization’s charts. To be clear, all data in the graphs are untouched and sourced from reliable, recognized sources. All data are factually correct, to help isolate the impact of our misleading visual design.
We aim to display the power of narrative data visualization, while also showing how truthful data, combined with selective narrative framing and visual techniques, can easily be made misleading.
You can read the whole report containing the explanations of the graphs here.
We use cookies to ensure that we give you the best experience on our website. If you continue to use this site we will assume that you are happy with it.